This is a guestpost by Alex Huckstepp of Digital Alloys
Metals production, from mining ore through manufacturing parts, accounts for 7% of our global energy use. While metal additive manufacturing (AM) has been promoted as a way to help us reduce our carbon footprint, this has not been well demonstrated with clear and complete information. Furthermore, there lacks a comprehensive comparison of energy consumption by the different metal AM processes. To optimize when, where, which, and how to implement AM, we must be able to assess its environmental impact and compare this to conventional manufacturing processes like CNC Machining.
For effective analysis, we must consider the whole manufacturing lifecycle. This includes all the steps from mining material to primary metal production, feedstock manufacturing, printing, post-processing, and any material recycling along the way:
We will analyze the energy consumption at each of the above process steps for titanium and tool steel, two of the most widely used metals in AM.
Mining and Primary Metal Production
The feedstocks used in AM and Machining both involve the same initial process: ore is mined and processed, and then the metal is alloyed and cast into an ingot. The energy consumed in these first steps must be understood to calculate the impact of downstream material waste. Material waste varies widely between manufacturing processes (including AM). We will discuss this further in the printing process section.
Titanium requires an exceptionally large amount of energy to process, almost 10 times that of steel. This is one of the reasons it is such an expensive material.
Feedstock Manufacturing
Almost all Metal AM processes consume powder or wire as the feedstock, while machining usually uses billet as the feedstock. Energy is required to process the ingot (large metal block formed in primary metal production) into these forms. Powder is created through gas atomization, a slow and expensive process. Wire is created by drawing metal through progressive dies. Metal plate is formed by hot rolling the ingot and then cut into various billet sizes.
Metal AM feedstocks require 3-4x more energy to manufacture than the billet used in machining. The wire drawing process is slightly more efficient than the gas atomization of powders, with higher yield. Binder Jetting feedstock production consumes the highest energy per kg because of addition of the binder.

Printing Process
Printing process energy includes both the primary printing energy (e.g., laser) and the secondary energy to operate the machine. Energy losses and secondary processes (motors, heaters, chillers, pumps, computers, etc.) of metal 3D printers are usually the largest contributors to total energy consumption. The total system energy use can be 5-10x the energy of the primary printing energy. For example, a laser powder bed system with a 500-watt laser consumes about 4,000 watts in operation. For most systems, secondary energy does not increase significantly with print speed. As a result, printing faster reduces energy consumption per unit output.

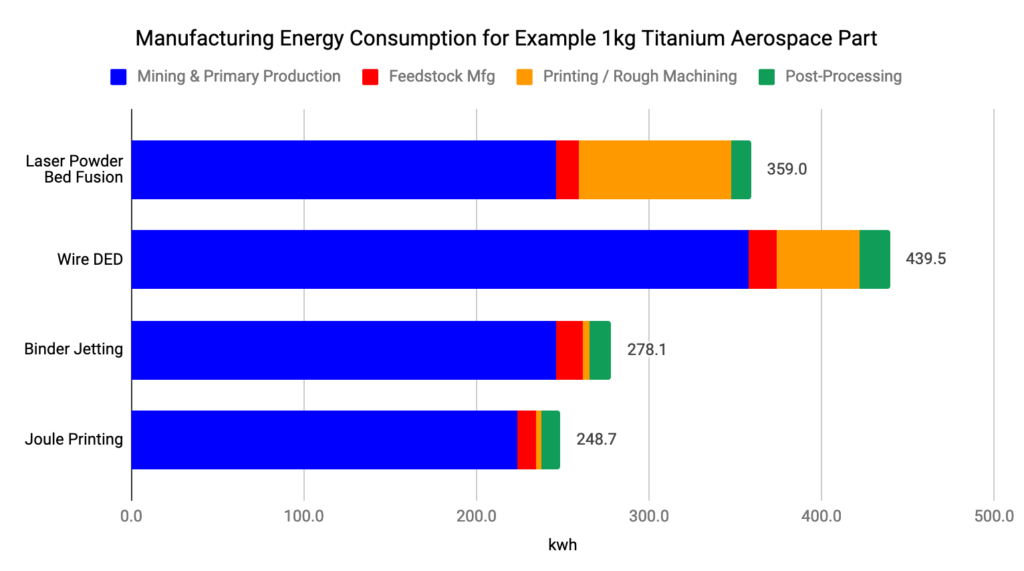
Joule Printing™ and Binder Jetting are the most efficient printing processes, and Laser Powder Bed Fusion is least efficient. Wire DED processes consume a lot of energy relative to Joule Printing™. Wire DED must maintain a large melt pool throughout the print, requiring excess heat. As a point of reference, at similar print speeds, Sciaky wire DED systems use a 40kw electron beam whereas Joule Printing™ uses less than 1kw of joule (aka resistive) heating. Multi-laser powder bed systems use about 1kw of laser power but print at speeds 25-100x slower than wire processes. Most of the energy consumption in Binder jetting happens in the secondary, furnace sintering step. It is important to compare these metal AM process energy consumptions to conventional alternatives like machining.
Roughing is the first CNC Machining step to mill material away from billet to achieve a near-net-shape part (similar to printing) before finish machining. Titanium and tool steel cannot be machined rapidly and wear the cutting tool. The data above represents the energy required to remove 1 kg of material. In contrast with AM, total machining energy consumption is highly dependent on the part geometry. More specifically, the ratio of the starting workpiece volume to final machined volume (the “buy-to-fly ratio”). In industries like aerospace this can average about 10:1 and sometimes even exceed 30:1. So, the total energy consumed by rough machining is the kwh/kg data above multiplied by the total weight of material removed.
Primary material production consumes more energy than most of the above processes do. Therefore, the energy consumption represented by the material waste is critical. The material waste in machining is represented by the buy-to-fly ratio. Calculation of the material waste in metal AM is more complex. There are two main contributors:
- Printed material waste, which includes near-net-shape expansion and support structures that will be removed in finish machining (post-processing). The total amount of printed material waste is highly dependent on geometry and process. Processes with the lowest resolution and freedom of geometry, like Wire DED, produce the most printed material waste.
- Un-Printed material waste, which is any material used in printing that does not go into the part but cannot be reused. This applies to powder bed processes where powder quality can be compromised as it is exposed to heat and oxygen during the printing process. In most cases, around 10% of the un-printed powder is scrapped. This can be as much powder as is printed. Powder reuse limitations are highly dependent on material, process and application
Since these two contributors of material waste are highly dependent on material, geometry and application, we will demonstrate their impact through analysis of a specific part below.
Post-Processing
There is a lot of variability in post-processing energy demands because of dependencies on geometry (support and finish machining requirements), process, and application specific requirements like heat-treatment (HIP-ing is often required in powder bed processes). The specific example below is the clearest way to illustrate this.
Material Recycling
Material recycling is an important factor because it enables manufacturers to recapture some of the energy in the material waste streams. A large percentage of material wasted throughout the feedstock manufacturing, printing and post processing can be re-processed and reused. On average, about 60% of the material waste is able to be recycled and about 80% of the energy already spent processing it (embodied energy) can be recaptured. This means that we can recapture about half of the embodied energy in the material waste streams. This is factored in to the below example.
Manufacturing Energy Consumption Case Study: Example Titanium Aerospace Part
The above part is a bracket used in the fuselage of a commercial aircraft. Today, it is manufactured by CNC machining from billet. This part has a 17:1 buy-to-fly ratio (see work piece volume represented in image) and is representative of a lot of aircraft components. For the purpose of this case study, we assume the final part weighs exactly 1 kg which requires a 17kg workpiece (billet).
We use the metrics above to calculate how much total energy is consumed in each step to manufacture this part, subtracting the energy we can recapture through recycling. We also account for material waste from the different processes:

Most of the energy in post processing goes to finish machining. The finish machining energy consumption is proportional to the amount of “printed material waste”. We estimate this to be 5% for the case of CNC Machining from billet. Finish machining titanium is very energy intensive, about 200 kwh/kg removed, but for most AM processes there isn’t much material removal required. The exception is Wire DED, which has a large amount of “printed material waste” due to its low resolution and geometry limitations. Heat treatments are another key post-processing step for metal AM. Stress relieving is usually a requirement but is relatively efficient, consuming less than 1 kwh/kg. Another post-processing step, HIP-ing, is used by powder bed processes to increase density and part strength. HIP-ing consumes about 1.5 kwh/kg. These heat treatment energy estimates assume parts are processed in large production batches. Energy consumption may be significantly higher at low volume.
Accounting for these post-processing calculations, along with the above material waste factors, allows us to calculate the total energy consumed (kwh) by the different processes:
CNC-ing high buy-to-fly titanium parts consumes much more energy than metal AM; 4-6x more in this example. The primary reason is due to the large amount of material waste generated by rough machining. This part is a great example of an application where metal AM can offer significant energy savings along with the potentially to reduce time and cost too.
To more closely compare the metal AM processes, we removed CNC machining from the chart:
Joule Printing™ is the most energy efficient end-to-end metal AM process, followed by Binder Jetting and Laser Powder Bed Fusion. Wire DED is the least energy efficient mostly due to its high material waste. LPBF wastes the most energy in the printing process. All these processes are dominated by the energy consumed in the primary metal production. The easiest ways to further reduce the energy footprint of metal AM are through reducing material waste and removing mass from design.
Environmental Impact
We know that energy consumption is bad for our environment, but we need to translate this quantitatively to environmental impact. Climate scientists are most concerned about the Carbon dioxide (CO2) emissions from energy generation. When and where you consume electrical energy from the power grid dictates how that energy was produced and the associated CO2 emissions. The below chart summarizes energy source and consumption by sector in the U.S.
In the U.S., energy consumption results in CO2 emissions ranging from 0.5 to 2 lbs CO2 / kwh. This should be an important consideration when determining where to locate your manufacturing operations. In the U.S., the average is about 1 lbs CO2 / kwh. We used this average to create the following chart of CO2 emissions for manufacturing life cycles for the example 1kg titanium aerospace part.
Again, removing CNC Machining so we can compare the metal AM processes more closely:
One way to analyze CO2 emissions is to look at the associated economics penalties that are going into place around the world to attempt to limit it and incentivize cleaner energy generation and lower energy consumption. Countries have already moved to tax CO2 emissions, also known as a “carbon tax”. In Europe this is currently about $30/ton. That is $.02/lb of emissions which equals $6 for the end-to-end manufacture of the example part. At these rates, carbon taxes are not yet having a large influence on manufacturing process selection, however, experts believe they will increase significantly in the future. Recent studies have estimated the “true social cost” of CO2 emissions to be in excess of $200. As carbon taxes increase, metal AM becomes even more valuable vs energy-intensive conventional processes.
Conclusion
For manufacturing processes that involve a lot of material waste like machining, metal AM offers an opportunity to reduce material and energy consumption. This is especially true for energy intensive raw materials like titanium. Among the metal AM processes, there is a large variance in energy efficiency due to the amount of material consumed and the printing process itself. For most parts, Joule Printing™ consumes the least amount of energy. The next most energy efficient process is Binder Jetting, however, more research needs to be done on the environmental impacts of burning off binder. Wire DED and Laser Powder Bed processes are relatively energy intensive but still offer advantages vs CNC for high buy-to-fly parts. This energy consumption and environmental emissions data must be used in combination with many other factors to make the best supply chain decisions for your business.
The data used in this post was compiled from many different pieces of research. The largest single source of information was provided by industry expert, Phil Reeves of Reeves Insight Ltd. When we found ranges of values or conflicting data, midpoints and averages were used.
We would like to acknowledge the following individuals for their help with this post:
- Phil Reeves, Reeves Insight Ltd.
- Joris Peels, 3DPrint.com
- John Barnes & Kevin Slattery, Barnes Group Advisors
- James Huckstepp – S&P Global Platts


